Retention Rate (RR) is the share of customers or users who are still with you at the end of a period. It is calculated in two different ways:
- Customer Retention Rate for a calendar period:
RR = (customers at end − new customers during period) ÷ customers at start × 100% - Retention Day N for a cohort:
Retention Day N = users active on Day N ÷ cohort size × 100%
The first is useful for subscriptions and e-commerce; the second is used for mobile apps and paid traffic. You cannot calculate both with one formula.
Retention matters not only in e-commerce but in any business you can measure. It is especially important when you have repeat purchases or subscriptions.
Updated August 10, 2026.
How Retention Rate Works
In sports, recent games are a useful checkpoint. In business, the equivalent is how happy your latest customers are.
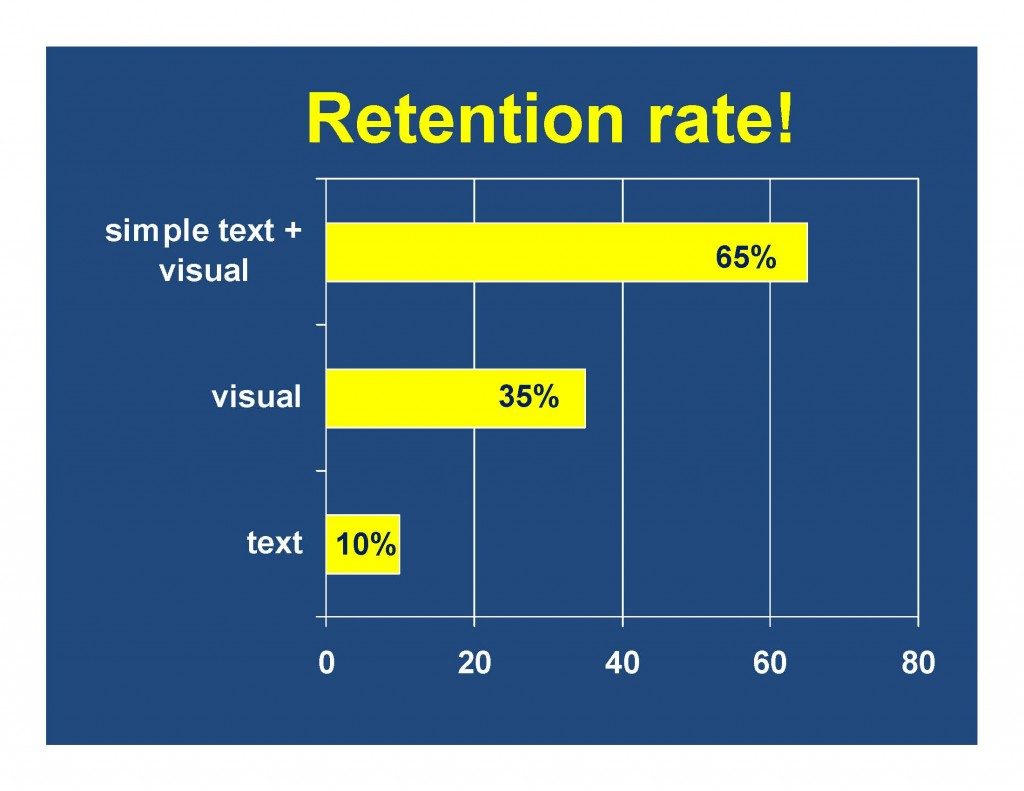
Customer retention shows how satisfied your customers are and how the business is developing. If you can keep more customers, the business has more room to grow.
How Do You Calculate Customer Retention Rate?
Customer Retention Rate is calculated with this formula:
- RR = (CE − CN) / CS × 100%
- CE = number of customers at the end of the period
- CN = number of new customers acquired during the period
- CS = number of customers at the start of the period
For example, you start the month with 100 customers. By the end of the month, you have 105 customers: 15 canceled and you acquired 20 new ones.
Using the formula above: (105 − 20) / 100 × 100% = 85%
In other words, 85% of the starting customers are still using your services.
Retention Day 1, Day 7, and Day 30 in Mobile
In apps and paid traffic, retention is calculated not over a month but by cohort—a group of users who installed the app on the same day.
Retention Day N = users from the cohort who returned on Day N ÷ cohort size × 100%
Example: 1,000 installs on Monday. On Tuesday, 340 users return, so Day 1 = 34%. A week later, 120 return, so Day 7 = 12%. A month later, 45 return, so Day 30 = 4.5%.
These are the details people most often get wrong:
- the denominator never changes—it is the original cohort size, not yesterday’s active-user count;
- Day 1 is the day after installation, not the installation day;
- compare like with like: Day 7 for Facebook traffic and Day 7 for incentivized installs are different universes.
Why Measure Customer Retention?
Some business owners do not worry about retention as long as their salespeople hit their targets and the business seems to be doing reasonably well. They may not see customer loyalty as an important part of the business.
Unfortunately, plenty of small business owners look at retention this way.
Many founders know exactly how many new customers they have because new customers make them feel good.
Far fewer know how many customers they lost because losses are depressing.
Here are three reasons customer retention matters:
- Losing a customer reduces future revenue and hurts the payback on acquiring them.
- Loyal customers can buy again and recommend you to other people.
- Replacing customers who leave adds another round of acquisition costs.
Retention rate is therefore one measure of how well you keep customers and how loyal they are. That is why it is worth calculating.
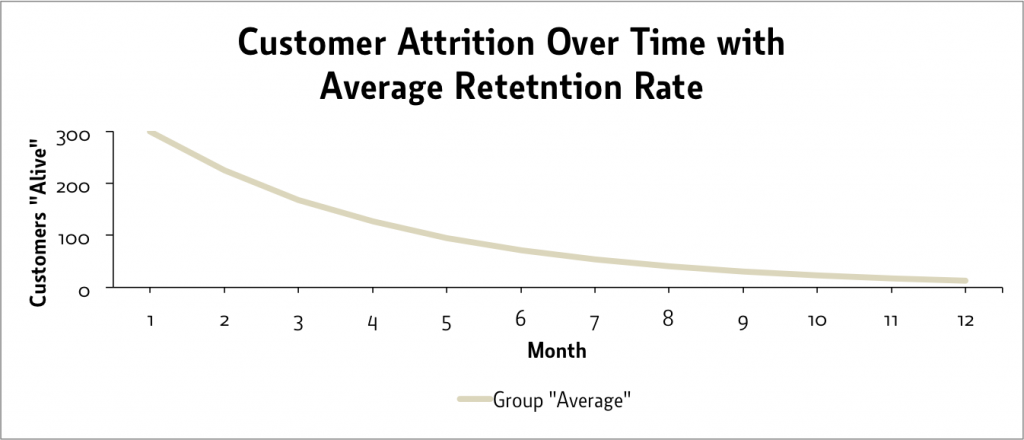
Once you measure it, you can evaluate the trend and find problem areas where customer loyalty can be improved.
And with a good K-factor plus decent retention, you can get formidable organic growth.
Customer Retention and Customer Loss
Customer retention is the proportion of customers who remain with you over a given period.
You can calculate it annually, monthly, or weekly.
In other words, customer retention is the percentage of customers who stayed with the company during a specific period.
Retention is sometimes confused with customer churn. They are connected: if a company has 20% churn, its retention is 80% for the same period and definition.
Churn rate is the percentage of customers lost during a specific period.
Comparing Customer Retention Rates
What counts as a good retention rate, and what should you aim for?
Like most metrics, a good retention rate depends on the niche.
The metric is relative across industries. An 85% retention rate can be excellent for one business and bad for another.
Ideally, all of us would love to see 90–100%, but that is not easy to achieve.
Do not look at retention in isolation. Over the same period, Churn = 100% − Retention, so churn rate is the same quantity viewed from the other side. Together with ARPU, retention helps estimate LTV—the number that ultimately constrains paid traffic. In mobile, cheap installs plus low Day 7 retention means the budget is disappearing into a hole, however good the conversion rate looks. You can find the other unfamiliar terms in the CPA glossary.
How is retention rate calculated?
For a calendar period: (customers at end − new customers) ÷ customers at start × 100%. For a cohort: users active on Day N ÷ cohort size × 100%.
What does retention rate show?
The share of customers who remain with the product. Indirectly, it can also signal product-audience fit and traffic-source quality.
How is retention rate different from churn rate?
They are the same quantity viewed from opposite sides: 80% retention equals 20% churn over the same period.
What is a normal retention rate?
It depends on the product, period, method, and cohort. Monthly Customer Retention cannot be compared directly with Day 30 retention for a mobile app; use equivalent cohorts from your own product and traffic source.
Bottom line
A high retention rate is one of the keys to a growing business. Take customer loyalty seriously and keep finding ways to improve it.
If you do not, you will miss opportunities to grow.